Silver Fundamentals: The Case for a Silver Bull Market in the Mid-Late 2020s
Key points:
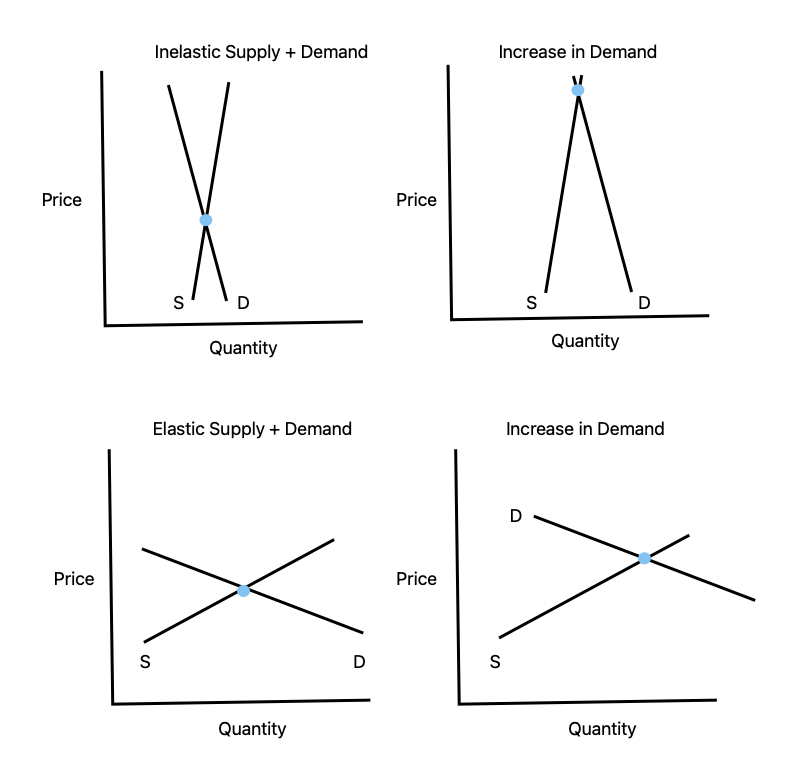
- Both silver supply and silver demand are inelastic.
- Persistent deficit as far as the eye can see and getting worse.
- Plateaued mining supply.
- ~1,200Moz in above ground stockpiles. Yearly deficit give or take 250Moz and rising.
- Will have to entice ETP or physical bullion holders to sell or price has to go high enough to curb demand. But remember demand is inelastic - huge opportunity for an explosion upwards because of this. Good luck at anything double digits.
Elasticity
Elasticity is a critical concept in economics and highly relevant to silver markets. If a good is price elastic, that good is highly sensitive to prices, and likewise, if the good is price inelastic, it’s insensitive to prices. The good’s elasticity can refer to either supply or demand. Supply could be elastic, meaning the supply of the good is highly sensitive to price changes, and demand could be inelastic, meaning the demand for a good is insensitive to price changes. Any combination of elastic and inelastic is possible for both supply and demand.
Water is a great example of something that has inelastic demand. You pretty much are going to consume the same amount of water regardless of price. If you were on a desert island, a billionaire, and about to die of dehydration, I could easily charge you a billion dollars for a bottle of water (if I lacked ethics, of course) and you’d gladly pay. Inversely, if I dropped the price of water to near 0, you’re pretty much drinking the same amount of water. You aren’t buying more water just because it’s cheap. What would you do with it?
Of course, it’s not perfectly elastic, as nothing is. If you lived in Phoenix and the price of water rose considerably, you might forego watering the lawn or maintaining your golf course. That’s because some uses of water are more elastic than others. Drinking water demand, however, is extremely inelastic while water demand, in general, is inelastic.
A good example of supply inelasticity are highly coveted islands owned by billionaires. For the most part, billionaires don’t care what price you’re offering because they’re already rich. Their land is pretty much unavailable. Yes, if you were a billionaire and offered an absurd price, you might be able to buy the land, but in general, the supply of tropical island paradises is inelastic. Any sale is more likely to take place due to something unrelated to price, like the billionaire getting bored with the island.
Something supply elastic would be Uber drivers during surge pricing. The higher the fares, the more drivers.
Something demand elastic would be vacations. If I offered free vacations to Cabo, just about everyone would take it. If I charged $50,000 to go to Cabo, practically no one would go.
The easier something is to produce, the more supply elastic it tends to be. The more discretionary something is, the more demand elastic it tends to be.
Silver’s Inelasticity
Silver, however, is neither easy to produce, nor discretionary. It is critical in electronics and solar panels. Solar panel technology has reduced the amount of silver per panel, but the total amount of silver being used for the industry as a whole is still increasing rapidly. Of course, like the water example above, silver does have some areas of demand that are somewhat discretionary, such as jewelry and silverware demand in India and China.1
However, while jewelry and silverware are discretionary, the Silver Institute’s own data shows relatively constant demand. With the exception of Covid in 2020, jewelry demand has hovered around 200 million ounces a year since 2015. Likewise, with the exception of 2020 and 2021, silverware has been about 60 million ounces a year since 2015. Even the drop during the peak Covid years was somewhat compensated for larger than average demand in 2022.2
So it seems, empirically, that while jewelry and silverware may be more elastic than other silver uses, those uses are still fairly inelastic.
Because silver is supply and demand is inelastic the price of silver can vary wildly and markets would still clear so long as there is enough supply for demand at that price.
Let’s assume both supply and demand is stuck at 1 billion ounces a year, regardless of price. If supply and demand are both insensitive to price, how is the price determined? The answer is whatever the market decides it’s worth. A paper written by the Silver Institute backs this theory when they state that a “prominent” driver of the silver price is investors.3
Obviously silver supply and demand are not perfectly inelastic, but the principle still applies. Investors (perhaps, especially in the paper silver markets) are determining the price of silver. However, if we reach a point where supply cannot meet demand, the price must go up so that demand is reduced. Supply and demand must always be equal.
Once demand outpaces supply AND both supply and demand are inelastic, the price has to explode upwards, and explode violently. Silver supply cannot be increased quickly and demand is difficult to reduce.

Right now, demand exceeds mining and recycling supply and it is only being satisfied by above ground stockpiles of silver.4
Silver Demand and Deficit
Silver tends to be used in relatively small amounts on a per unit basis in industrial settings and also happens to be the most conductive element that exists. Because of its relatively low contribution to the overall cost of the product (10-12% for PVs as of 20245, 15-28g for internal combustion engine vehicles6, 350 mg of silver for cellphones7, etc…), the price of silver could rise considerably before the increase in the total cost of production is meaningful. Overall, industrial demand is on a solid uptrend that looks exponential, especially solar.
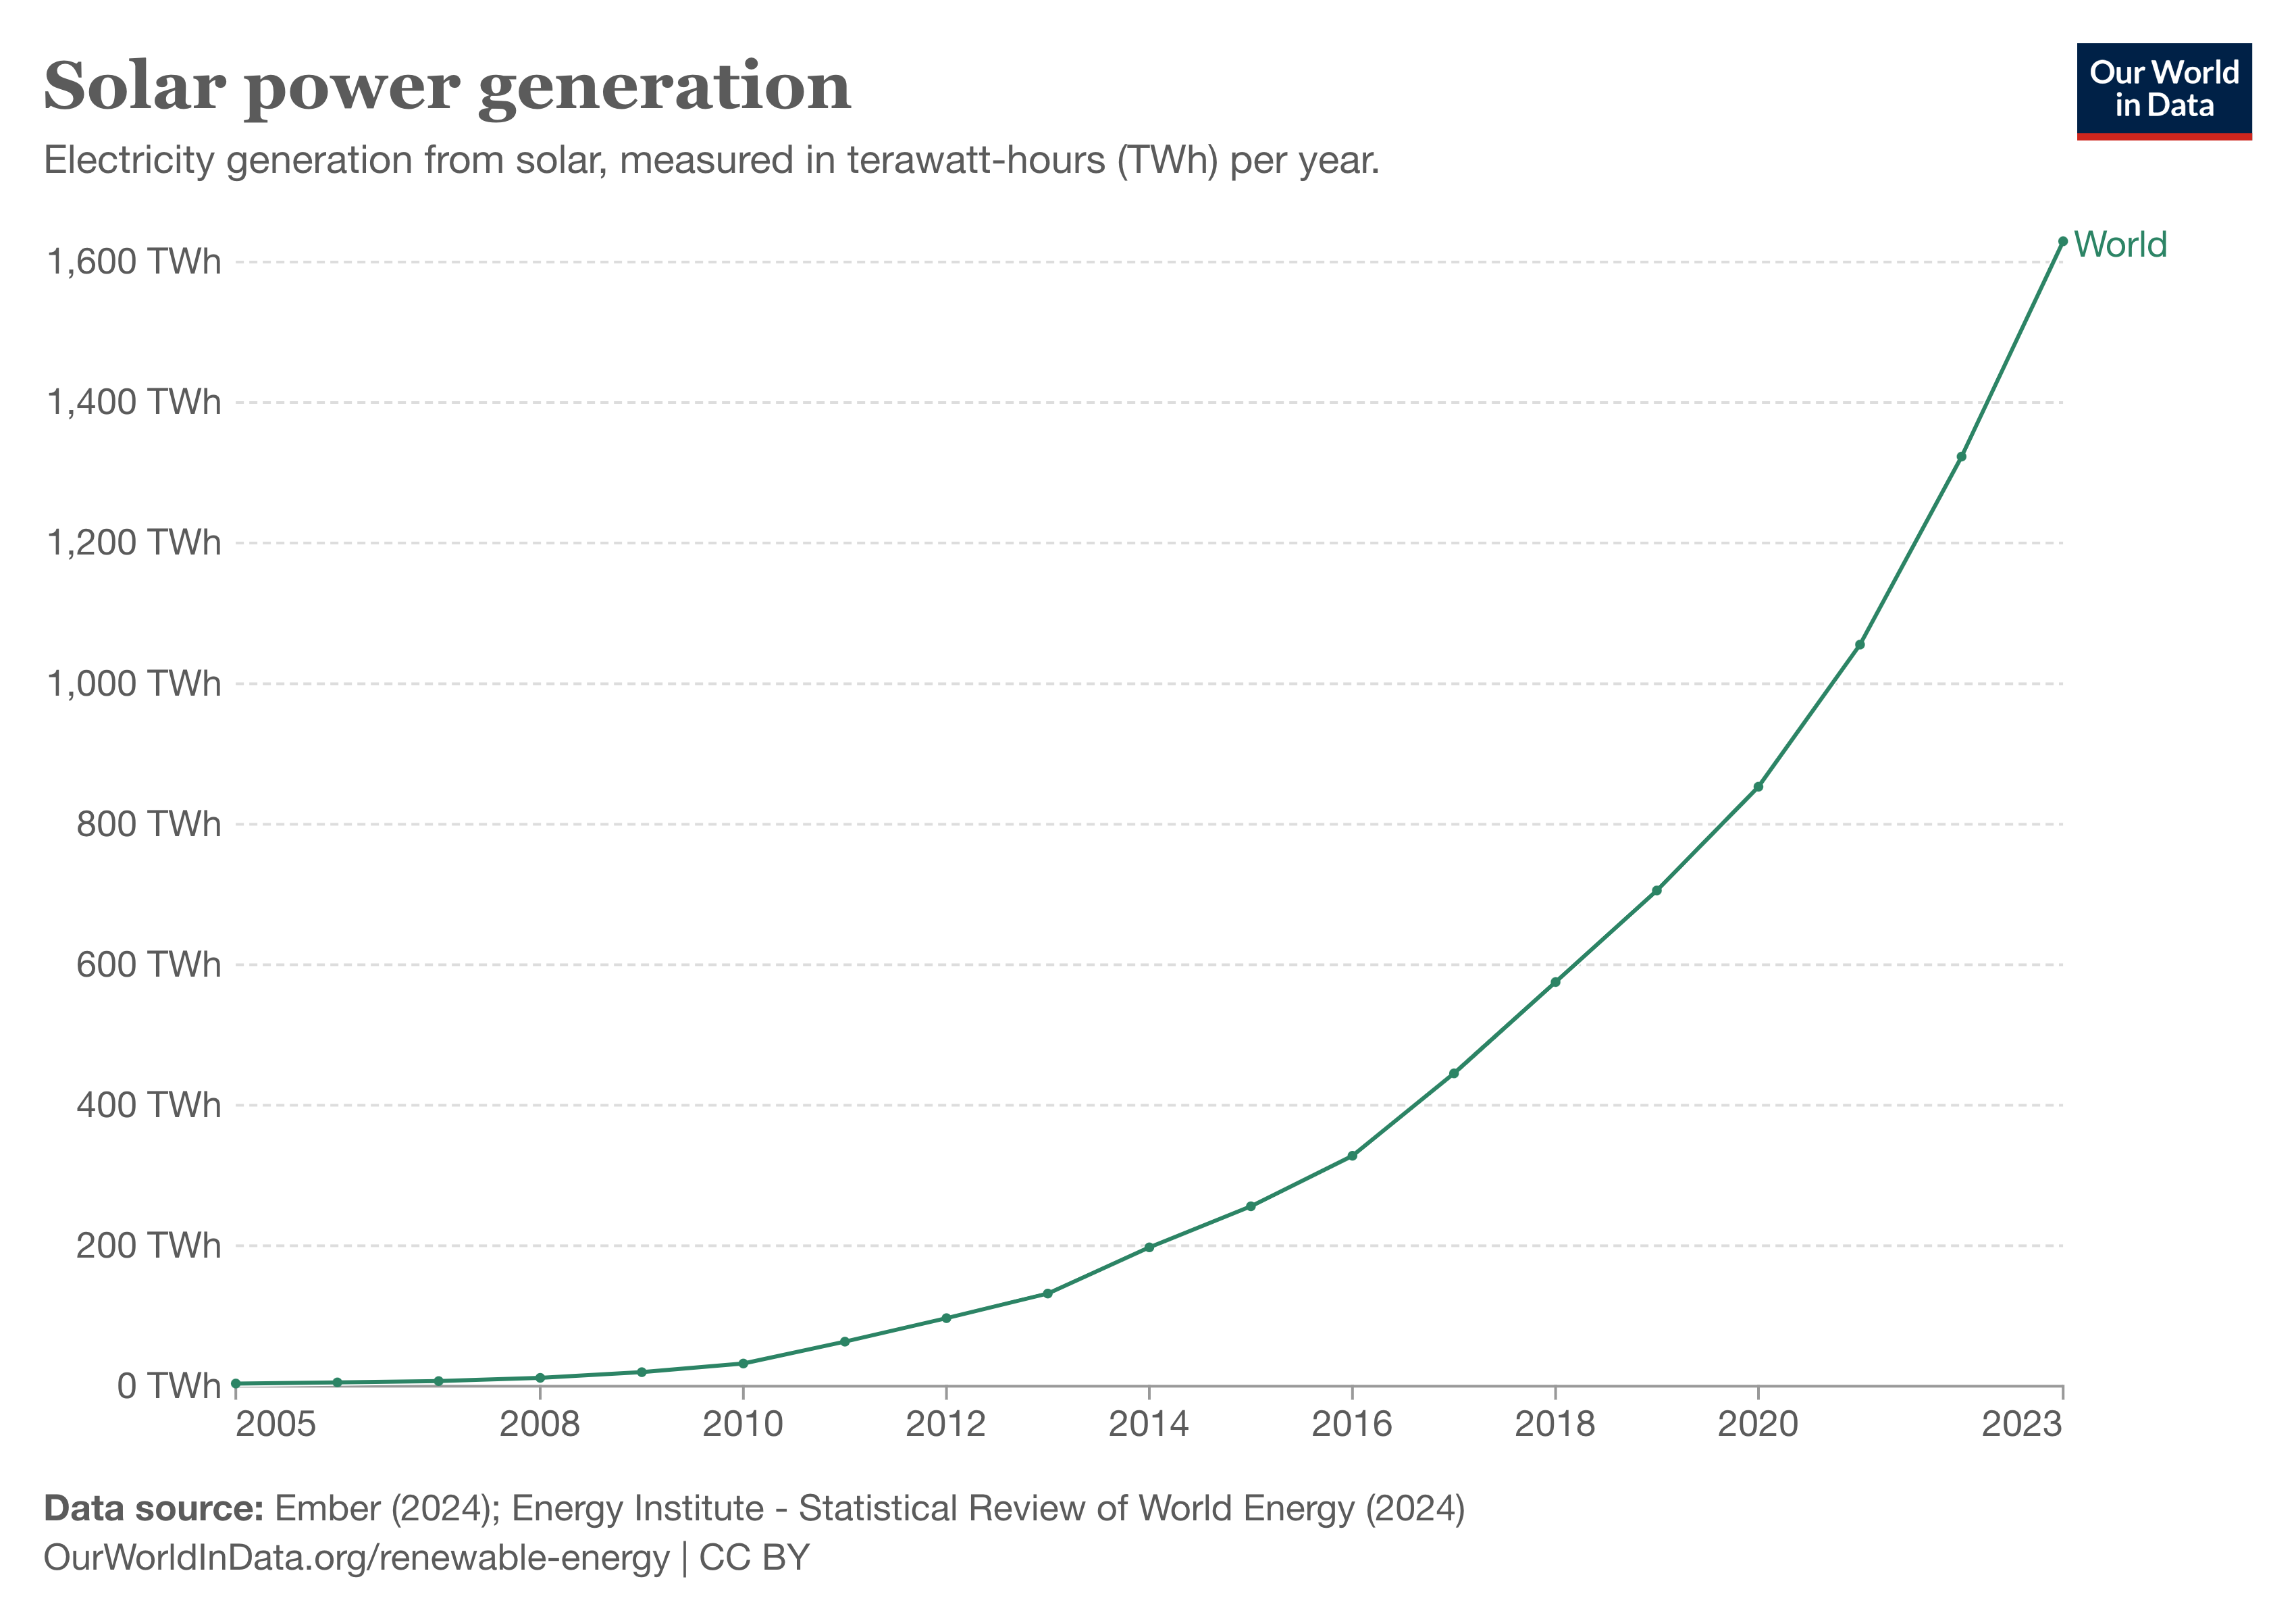
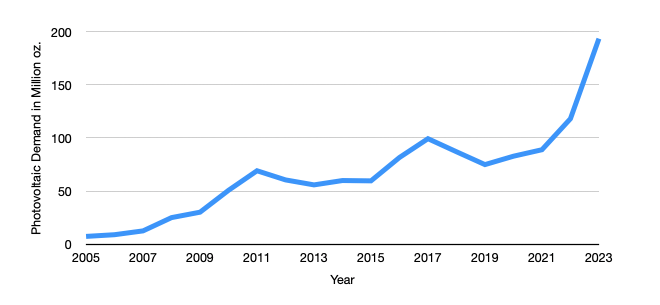
Below you’ll see charts for solar generation and the amount of silver use in photovoltaics from 2005-2023. As you can see, world solar power generation is clearly exponential without any sign of slowing. (A special thanks to Chris Martenson for bringing solar’s exponential growth to my attention and who also did his own excellent analysis of silver’s investment potential.)8


Use of silver in photovoltaics, 2005-20239
However, the chart for silver usage in photovoltaics is not as clearly exponential. 2005-2011 appears to be exponential, but silver usage plateaued from 2011-2015. From 2016-2019, silver usage was mostly unchanged. Then, from 2019-2023 silver usage becomes exponential again.
If the amount of mg/W (milligrams/Watt) of silver stayed constant, the usage of silver would look as perfectly exponential as the solar power generation chart. However, the amount of mg/W needed fell over 60% from 2010 to 2013. Then, from 2013-2021, mg/W fell another ~60%. However, the rate of decline has been falling, especially from 2021-2023 where it fell approximately 16%.10
That’s a 26.3% annual decline from 2010-2013, 10.8% annual decline from 2013-2021, and a 8.3% decline from 2021-2023.
The rate of silver mg/W has declined rapidly and is no longer keeping up with the exponential demand for solar installations.
Helping this trend is the industry switching to n-type cells. The Silver Institute is predicting that for 2024, n-type cells will be the majority of the solar panel market.11 N-type cells use approximately 20-30% (possibly even higher)1213 more silver per unit than the previously dominant PERC cells. Compare that to 2022 where n-type cells were around 15% of the overall market.14
A paper in Progress in Photovoltaics attempted to provide a broad range of estimates of silver usage in solar panels varying by solar panel adoption and better efficiencies in silver use.
See important quotations from study including charts below:15
"However, with the typical annual PV industry growth rate being higher than the rate of silver reduction per year, future expansion of the industry will likely continue to increase the annual silver demand, particularly if there is a transition to silver-intensive n-type technologies."
"The broad electrification scenario (IRV21 Broad) could require more than 10, 15 or 17.6kt/year (43%, 64% or 75% of global supply) of silver in 2030 with Industry, 100% PERC or a rapid shift to n-type technologies, respectively."
"Such a transition could increase annual silver demand to over 10kt/year by 2027 if dominated by n-type TOPCon."

This study was first published in December 2022 with actual data points only up until 2021, so we can fill in the remaining years up until 2023. In 2022 and 2023 actual silver usage in PVs was 3.7 kilotons and 6.0 kilotons, respectively. 2021, the last red dot on the left chart, was 2.8 kilotons. And while we don’t have the data yet, the Silver Institute predicts 7.2 kilotons for 2024.16
This trend, so far, follows the broad electrification scenario which is the filled-in yellow portion on the left chart. Additionally, we already know the industry has moved towards n-type cells, which would seem to suggest we are on the most aggressive path outlined in the left chart - n-type cells with broad electrification. As shown on the chart, if that trend holds, and that is a big if, by 2030, silver usage would be 17.5 kts just for PVs. To put that in perspective, the entire world mine supply in 2023 was 25.8 kts. As of 2023, not including changes in ETP holdings, the silver deficit was 5.7 kts.17 Holding all other demand factors equal except photovoltaics, the deficit would be 17.2 kts in 2030. 17.2 kts is 501.7M troy oz. You’ll see later why that deficit and the annual deficits leading up to that deficit will be unsustainable at anything close to the current silver price.
Of course, it’s impossible to predict the future over the next 6 years. We don’t know how efficient solar panels will get (see above chart on right) and we don’t know if this aggressive solar panel demand, driven especially by China18, will continue.
That being said, a ballpark deficit in silver might be 200Moz in 2024, 250M in 2025, 300M in 2026, 350M in 2027, 400M in 2028, 450M in 2029, and 500M in 2030. Other industrial demand for silver is growing too, so even if the most aggressive PV scenario doesn’t come to pass, these deficits are still feasible. You can reduce each deficit year by 100 or 200Moz in some of the later years if you want. The story is pretty much the same. There is too much demand for silver relative to supply. Above ground stockpiles can only supply so much before ETPs and investor-held bars, coins, jewelry, or scrap silverware have to fill the gap.
Silver Supply Plateau
Silver supply can respond to higher prices, but the response is slow and limited. It “can take anywhere from 10-20 years” from silver discovery to silver production.19
The mining supply forecast from the Silver Institute is a "rise [in production] from 2025," but longer-term is "likely to fall as the depletion of reserves outweighs supply from new projects".20 Current mining supply has been on downward trend since 2016 when mine supply peaked at 899.8M ounces compared with 830.5M ounces in 2023. Recycling has increased from 145.7M in 2016 to 178.6M in 2023 but has not compensated for the decline in mining output. Total supply including all factors was 1,046.5M in 2016 and 1,010.7M in 2023.21
Only 28.3% or 235.2M oz of silver supply came from primary silver miners in 2023. The rest of the silver mining supply primarily comes from lead, zinc, copper, and gold mining which makes 71.7% of silver’s supply even more inelastic.22
You might be wondering if silver scrap would increase with higher prices. Cash strapped owners of silver may sell whatever they can find including old jewelry, silver, and other heirlooms. However, even in 2011, when prices went to nearly $50/oz, scrap supply only increased 60.3M oz from 2009. If 2011 had the same scrap supply as 2009, 2011 total supply would have been 980.8M oz instead of it’s actual 1,041.1M oz. The increase in scrap only increased the total supply by 6.1%. In 2009, prices averaged $14.67/oz vs. $35.12 in 2011.23
The Silver Institute also concluded only minute supply changes in their own comparison from 2008-2011 in their Market Trend Report.24
Given how long it takes to bring mines to production and scrap metal’s limited contribution, total silver supply is likely to continue its stagnation throughout the rest of the 2020s.
Above Ground Stockpiles
According to the 2024 World Silver Survey, "Identifiable Silver Bullion Inventories" were 1,229.9Moz of which 856.2Moz were in London vaults, 277.9Moz at the COMEX, 46.5Moz at the Shanghai Gold Exchange, 38.2Moz at the Shanghai Futures Exchange and 4.1Moz at "Other". That is down from 1,666.9 Moz in 2021.25
Let’s, for the sake of argument, say all above ground stockpiles are readily available for sale at the current price of silver. Going with the ballpark deficit above, all identifiable silver inventories would be gone by 2028. (Interestingly, that fits within Chris Martenson’s 2026-2028 time range of industrial demand exceeding mine supply).26 Note that doesn’t count for unidentifiable above ground stockpiles. Unidentified stockpiles, however, have not had a major effect on the data. The cumulative deficit from 2021-2023 without factoring in ETPs was 543.1Moz, with ETPs 440.2Moz, and the drawdown of identifiable stockpiles was 444.0Moz.27
If these stockpiles were eliminated, the only above ground silver left would be ETP-held silver not part of the “Identifiable Silver Bullion Inventories”, physical silver bullion held by investors, and scrap silver in the form of jewelry, silverware, etc…
While plentiful, that type of silver, with the exception of ETPs, will not come on the market without the price of silver increasing significantly. As mentioned previously, even after average yearly prices more than doubled from 2009-2011, the total increase in scrap silver only added 6.1% to the total silver supply. If the deficit is 400M in 2028 and this is the only source of silver, the extra 60.3Moz that came from the 2009-2011 price run up isn’t going to cut it. No one knows for certain how high the price would have to go, but it would need to be considerable.
Some degree of common sense might be useful here too. The average physical silver buyer tends to be serious, long-term investor that isn’t interested in trading silver based on small price fluctuations. If physical buyers wanted to get in and out of silver, they’d buy stocks, ETFs, or futures.
As for jewelry and silverware, how many people have enough for them to even think about selling? If you have $500 worth of silver in jewelry, would you sell if it was worth $1500? How many people are even paying attention to the price of silver? The same goes for silverware. By the time the average person would even consider selling their scrap silver, the price would have had to risen enough that mainstream media was actively covering it.
In short, the readily available silver could be gone by the late 2020s with only a significantly higher price increasing supply. If ETF holders don’t want to sell their silver or want to buy more, then the supply situation becomes even tighter. These diminishing stockpiles, supply/demand fundamentals, and silver’s price inelasticity should make for an interesting, and potentially explosive, few years to come.
Works Cited
- 1 Silver Institute. Silver Market Trend Report 2024. Silver Institute, 2024, https://www.silverinstitute.org/wp-content/uploads/2024/02/SilverMarketTrendReport2024.pdf, pg. 10.
- 2 Silver Institute. World Silver Survey 2024. Silver Institute, 2024, https://www.silverinstitute.org/wp-content/uploads/2024/04/World-Silver-Survey-2024.pdf, pg. 9.
- 3 Silver Market Trend Report 2024, pg. 11.
- 4 World Silver Survey 2024, pg. 9.
- 5 Silver Institute. Metals Focus WSS 2024 Launch. Silver Institute, 2024, https://www.silverinstitute.org/wp-content/uploads/2024/04/Metals-FocusWSS2024Launch.pdf, pg. 24.
- 6 "Silver Consumption in the Global Automotive Sector to Approach 90 Million Ounces by 2025." Silver Institute, 12 Jan. 2021, https://www.silverinstitute.org/silver-consumption-global-automotive-sector-approach-90-million-ounces-2025/.
- 7 Arthur, Charles. "Old iPhones worth big bucks." CNN Business, 13 Oct. 2011, https://money.cnn.com/2011/10/13/technology/iphone_trade_in/index.htm.
- 8 Martenson, Chris. "A Full Analysis of the Investment Thesis for Silver." Peak Prosperity, https://peakprosperity.com/a-full-analysis-of-the-investment-thesis-for-silver/. Accessed 9 July 2024.
- 9 World Silver Survey 2024, pg. 9.
- 10 Metals Focus WSS 2024 Launch., pg 24.
- 11 Metals Focus WSS 2024 Launch., pg 24.
- 12 VRIC Media. “How the Solar Panel Industry Will Push Silver Into a Major Bull Market: Chen Lin.” YouTube, www.youtube.com/watch?v=qSfcFBVIWsw, 11m.
- 13 Hallam B, Kim M, Zhang Y, et al. The silver learning curve for photovoltaics and projected silver demand for net-zero emissions by 2050. Prog Photovolt Res Appl. 2023; 31(6): 598-606. doi:10.1002/pip.3661, https://creativecommons.org/licenses/by/4.0/.
- 14 Metals Focus WSS 2024 Launch, pg. 24.
- 15 Hallam B, Kim M, Zhang Y, et al., https://creativecommons.org/licenses/by/4.0/.
- 16 World Silver Survey 2024, pg. 9.
- 17 World Silver Survey 2024, pg. 65.
- 18 Metals Focus WSS 2024 Launch, pg. 22.
- 19 "Silver Mine Life Cycle." AGMR, https://www.agmr.ca/silver-mine-life-cycle/. Accessed 8 July 2024.
- 20 World Silver Survey 2024, pg. 17.
- 21 World Silver Survey 2024, pg. 9.
- 22 World Silver Survey 2024, pg. 9.
- 23 2015 World Silver Survey. Silver Institute, 2015, https://www.silverinstitute.org/wp-content/uploads/2017/10/2015WorldSilverSurvey.pdf, pg. 8.
- 24 Silver Market Trend Report 2024, pg. 9.
- 25 World Silver Survey 2024, pg. 26.
- 26 Martenson, Chris. "A Full Analysis of the Investment Thesis for Silver."
- 27 World Silver Survey 2024, pg. 26.
